7. April 2023
A computer scientist's attempt at tracking the effect of training without testing
 How to find out whether the effort put into training actually increased performance? I asked myself whether there is a shortcut to testing benchmark protocols, whether in the lab or in the outdoors. As you may already have guessed, shortcuts are rare in training. But sometimes, it’s fun looking for one.
Like in previous posts such as https://www.athoughtabroad.com/2020/05/25/a-computer-scientist-s-diagram-of-heart-and-lung-supplying-the-muscles-with-oxygen or A computer scientist’s diagram of heart and lung supplying the muscles with oxygen, I am looking at sports as a learnt computer scientist and an amateur runner, rather than a professional coach or sports scientist. However, I look at sports with curiosity, and with the mindset of a tinkerer.
Renato Canova said “Training is not the work you do but the effect it has on your body” [1].
If better performance were the goal of my training, then the effort I put into training better has the desired effect on my body, and that change in turn better makes me perform better, as well. Otherwise, the training would be wasted effort with respect to this goal. Thus: How to track gains or losses in performance?
- If I care about performance in a particular race, that race is surely the ultimate test: highly specific and totally realistic. But this test is too late in order to change anything in the training.
- Running the race course during the preparation at maximum effort “as a test” is not attractive either: it would take too much out of me, and performing the test would negatively affect my training itself.
- I could go to a lab and run on a treadmill, measuring various parameters that can be relevant to performance, such as the speed at which your fat metabolism is greatest, the aerobic threshold, the lactate threshold, the rate of maximum oxygen consumption, the rate of maximum lactate production, and so on. It’s great fun to run around like Darth Vader on a treadmill, but it’s time-consuming, costs money, the results take effort to interpret, and the parameters measured on a treadmill do not directly transfer to hilly single trails dotted with rocks and criss-crossing roots.
- I can follow one of the (structured) testing protocols readily described in books or the internet, going on a nearby track. This has the benefits of being cheaper than going to the lab, and requires no appointment.
- Or, in a similar spirit, I can pick a particular trail/road segment in your neighborhood, and every now and then see how fast I can complete that segment. This is overall appealing. But well, this test also requires effort.
Is there a shortcut? Can I do the testing from my armchair at home?
I recently explored an idea. I could take a 670m long climb with a 21% average slope that ITurns out (of course!) that the idea was not new. A quick Google search yielded a paper introducing the “Heart Rate-Running Speed Index” [3] as a method to monitor adaptation endurance training. Specifically, the authors write in the intro that “Based on the previous researches (6,14,18,19), we expected that submaximal exercise HR would decrease progressively during the training period as a consequence of an increase in cardiorespiratory fitness” [3]. I also observed a decrease of about ~5bpm in my (morning) resting heart rate over the past three months (prior post), which seems to be a similar effect.
However, my tinkering mindset took over, and I looked into the aforementioned Strava segment (670m long, 140m vertical gain, 21% slope), and downloaded (speed, avg./max. heart rate) data for analysis. The samples are influenced by factors such as weight carried (I take my backpack with several kilograms during commutes) and potentially also by difference in measurement (different heart rate monitors).
I then used Looker Studio to plot heart rate against speed. I also added a trend line (linear regression using the sum of least squares). Here is the plot of all 68 segment efforts in 2022 and 2023 combined:

The statistics student in myself remembers to use R and compute the correlation coefficient, but since I am not performing a scientific study, I just look at the above chart and visually confirm that (a) there is indeed good correlation between heart rate and speed, (b) but that there are measurements ~15bpm apart for the same speed, despite of the conditions being controlled for terrain and vertical gain.
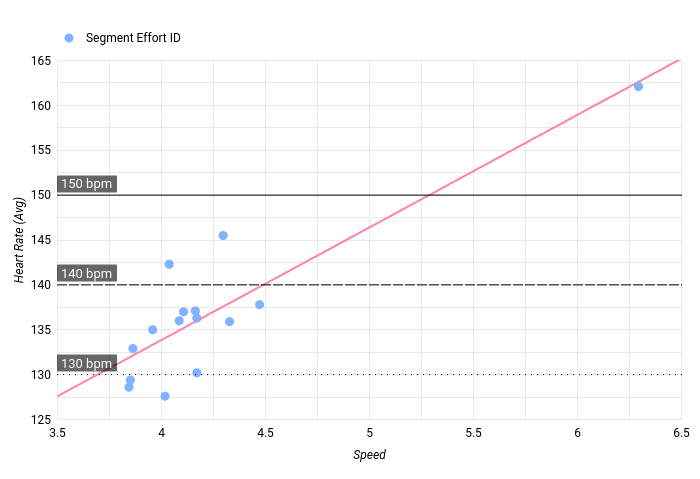
Was there a difference between 2022 and 2023? Let’s look at 2023 only:

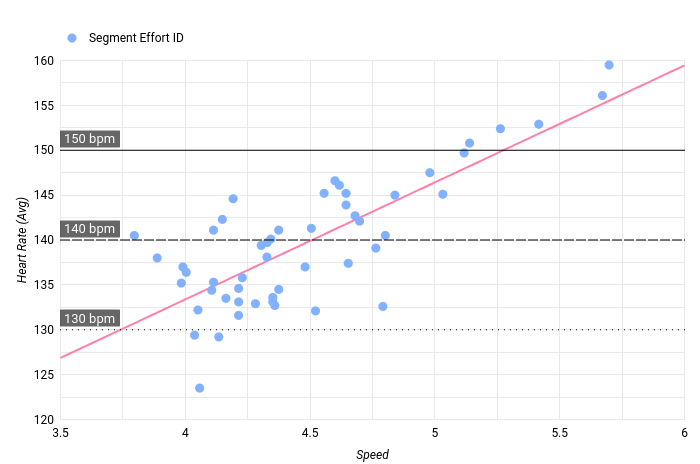
Let’s look at 2022 only (below):

Interestingly by looking at the three reference heart rates I picked (130 bpm, 140 bpm, 150 bpm), there is very little difference. Through visual inspection (as Looker Studio did not allow me to read off the values from the trend line):
| Heart Rate | 2022 | 2023 |
|---|---|---|
| 130 bpm | 3.75 km/h | 3.7 km/h |
| 140 bpm | 4.5 km/h | 4.5 km/h |
| 150 bpm | 5.25 km/h | 5.3 km/h |
Assuming that [changes in] performance are indeed linked to [changes in] heart rate at given speeds, this vaguely suggests that I am about as fit this year as I was last year. But how strong is that link? I really don’t know. In conclusion, I’d hardly claim that I found a shortcut based on this adhoc exploration. But it was fun to look at.
References
[1] House, Steve, Scott Johnston, and Kilian Jornet. 2019. Training for the Uphill Athlete: A Manual for Mountain Runners and Ski Mountaineers. Patagonia Works.
[2] Koop, Jason. 2016. Training Essentials for Ultrarunning: How to Train Smarter, Race Faster, and Maximize Your Ultramarathon Performance. VeloPress.
[3] Vesterinen, Ville, Laura Hokka, Esa Hynynen, Jussi Mikkola, Keijo Häkkinen, and Ari Nummela. 2014. “Heart Rate-Running Speed Index May Be an Efficient Method of Monitoring Endurance Training Adaptation.” Journal of Strength and Conditioning Research / National Strength & Conditioning Association 28 (4): 902–8.